为了能够更加直观的了解 Prometheus Server,接下来我们将在本地部署并运行一个 Prometheus Server 实例,通过 Node Exporter 采集当前主机的系统资源使用情况。
本文基于 MacOS Go1.15.8
安装 Prometheus Server
Prometheus 基于 Golang 编写、编译后的软件包,不依赖于任何的第三方依赖。用户只需要下载对应平台的二进制包,解压并且添加基本的配置即可正常启动 Prometheus Server。
从二进制包安装
对于非 Docker 用户,可以从 https://prometheus.io/download/ 找到最新版本的 Prometheus Sevrer 软件包:
1
2
|
export VERSION=2.25.0
curl -LO  https://github.com/prometheus/prometheus/releases/download/v$VERSION/prometheus-$VERSION.darwin-amd64.tar.gz
|
解压,查看 Prometheus 目录结构:
 1
 2
 3
 4
 5
 6
 7
 8
 9
10
11
12
13
14
15
16
17
18
19
20
21
22
23
24
25
26
27
28
|
tar -xzf prometheus-2.25.0.darwin-amd64.tar.gz
cd prometheus-2.25.0.darwin-amd64

tree -L 2 .
.
├── LICENSE
├── NOTICE
├── console_libraries
│   ├── menu.lib
│   └── prom.lib
├── consoles
│   ├── index.html.example
│   ├── node-cpu.html
│   ├── node-disk.html
│   ├── node-overview.html
│   ├── node.html
│   ├── prometheus-overview.html
│   └── prometheus.html
├── data
│   ├── chunks_head
│   ├── lock
│   ├── queries.active
│   └── wal
├── prometheus
├── prometheus.yml
└── promtool

5 directories, 16 files
|
解压后当前目录会包含默认的 Prometheus 配置文件 promethes.yml:
 1
 2
 3
 4
 5
 6
 7
 8
 9
10
11
12
13
14
15
16
17
18
19
20
21
22
23
24
25
26
27
28
29
|
# my global config
global:
  scrape_interval:     15s # Set the scrape interval to every 15 seconds. Default is every 1 minute.
  evaluation_interval: 15s # Evaluate rules every 15 seconds. The default is every 1 minute.
  # scrape_timeout is set to the global default (10s).

# Alertmanager configuration
alerting:
  alertmanagers:
  - static_configs:
    - targets:
      # - alertmanager:9093

# Load rules once and periodically evaluate them according to the global 'evaluation_interval'.
rule_files:
  # - "first_rules.yml"
  # - "second_rules.yml"

# A scrape configuration containing exactly one endpoint to scrape:
# Here it's Prometheus itself.
scrape_configs:
  # The job name is added as a label `job=<job_name>` to any timeseries scraped from this config.
  - job_name: 'prometheus'

    # metrics_path defaults to '/metrics'
    # scheme defaults to 'http'.

    static_configs:
    - targets: ['localhost:9090']
|
运行 Prometheus Server:
 1
 2
 3
 4
 5
 6
 7
 8
 9
10
11
|
./prometheus --config.file="prometheus.yml" --web.listen-address="0.0.0.0:9090"
level=info ts=2021-02-13T03:12:43.647Z caller=main.go:366 msg="No time or size retention was set so using the default time retention" duration=15d
level=info ts=2021-02-13T03:12:43.648Z caller=main.go:404 msg="Starting Prometheus" version="(version=2.25.0-rc.0, branch=HEAD, revision=526095f9fa6159a49a3adce177f3294ebcf37b1f)"
level=info ts=2021-02-13T03:12:43.648Z caller=main.go:409 build_context="(go=go1.15.8, user=root@2111579c2ad1, date=20210212-19:11:41)"
level=info ts=2021-02-13T03:12:43.648Z caller=main.go:410 host_details=(darwin)
level=info ts=2021-02-13T03:12:43.648Z caller=main.go:411 fd_limits="(soft=256, hard=unlimited)"
level=info ts=2021-02-13T03:12:43.648Z caller=main.go:412 vm_limits="(soft=unlimited, hard=unlimited)"
level=info ts=2021-02-13T03:12:43.655Z caller=web.go:532 component=web msg="Start listening for connections" address=0.0.0.0:9090
level=info ts=2021-02-13T03:12:43.658Z caller=main.go:779 msg="Starting TSDB ..."
level=info ts=2021-02-13T03:12:43.662Z caller=tls_config.go:191 component=web msg="TLS is disabled." http2=false
......
|
使用容器安装
对于 Docker 用户,直接使用 Prometheus 的镜像即可启动 Prometheus Server:
1
|
docker run -p 9090:9090 -v /etc/prometheus/prometheus.yml:/etc/prometheus/prometheus.yml prom/prometheus
|
启动完成后,可以通过 http://localhost:9090/graph 访问 UI 界面:
安装 Node Exporter
在 Prometheus 的架构设计中,Prometheus Server 并不直接服务监控特定的目标,其主要任务负责数据的收集,存储并且对外提供数据查询支持。因此为了能够能够监控到某些东西,如主机的 CPU 使用率,我们需要使用到 Exporter。Prometheus 周期性的从 Exporter 暴露的 HTTP 服务地址(通常是 /metrics)拉取监控样本数据。
从上面的描述中可以看出 Exporter 可以是一个相对开放的概念,其可以是一个独立运行的程序独立于监控目标以外,也可以是直接内置在监控目标中。只要能够向 Prometheus 提供标准格式的监控样本数据即可。
这里为了能够采集到主机的运行指标如 CPU, 内存,磁盘等信息。我们可以使用 Node Exporter。
我们再回顾下 Prometheus 架构设计图:
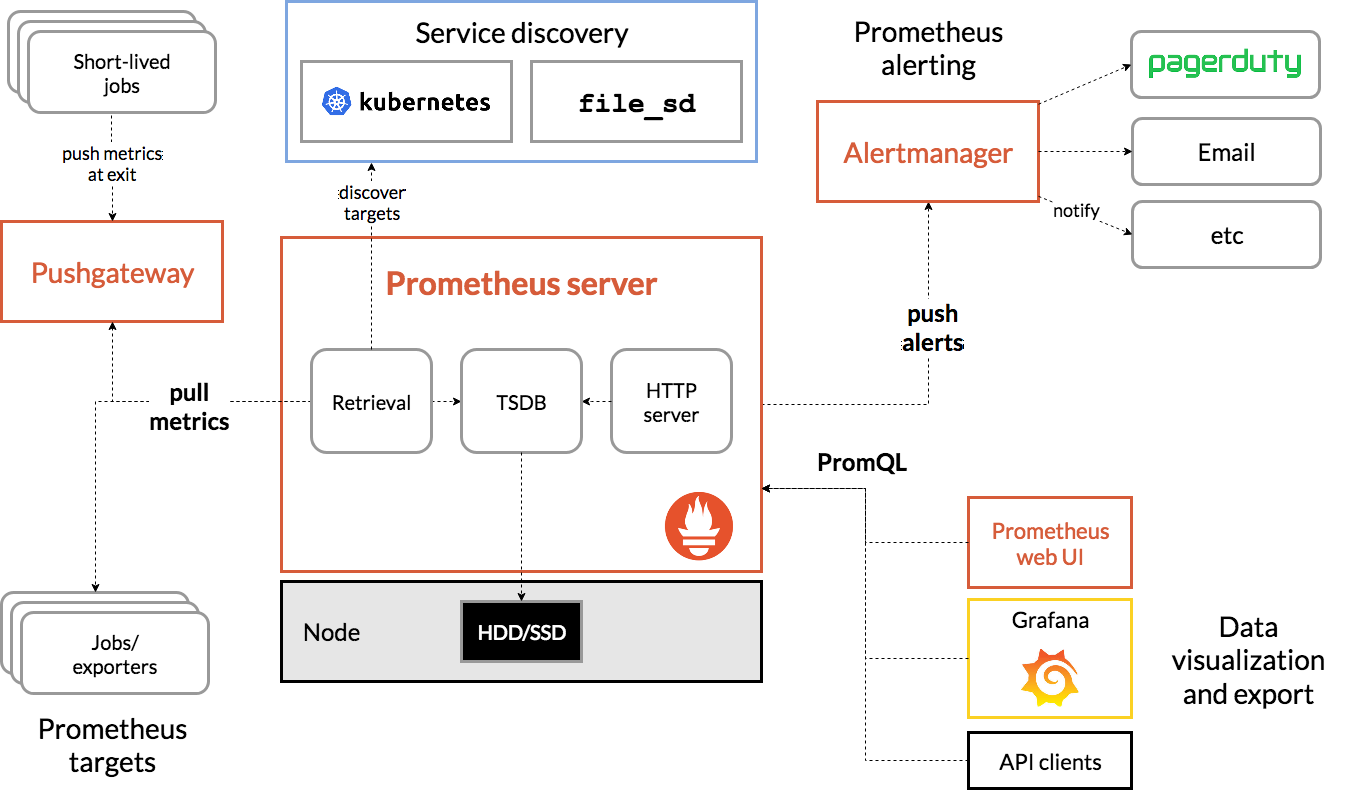
Node Exporter 同样采用 Golang 编写,并且不存在任何的第三方依赖,只需要下载,解压即可运行。可以从 https://prometheus.io/download/ 获取最新的 Node exporter 版本的二进制包。
1
2
|
curl -OL https://github.com/prometheus/node_exporter/releases/download/v1.1.0/node_exporter-1.1.0.darwin-amd64.tar.gz
tar -xzf node_exporter-1.1.0.darwin-amd64.tar.gz
|
运行 Node exporter:
1
2
|
cd node_exporter-1.1.0.darwin-amd64
./node_exporter
|
启动成功后,可以看到以下输出:
1
2
3
4
5
6
7
8
|
./node_exporter
level=info ts=2021-02-13T03:37:54.502Z caller=node_exporter.go:178 msg="Starting node_exporter" version="(version=1.1.0, branch=HEAD, revision=0e74fbcd5fe3b98246292829a8e81e3133e17033)"
level=info ts=2021-02-13T03:37:54.503Z caller=node_exporter.go:179 msg="Build context" build_context="(go=go1.15.8, user=root@cf7d8c880095, date=20210205-23:04:01)"
level=info ts=2021-02-13T03:37:54.503Z caller=filesystem_common.go:74 collector=filesystem msg="Parsed flag --collector.filesystem.ignored-mount-points" flag=^/(dev)($|/)
level=info ts=2021-02-13T03:37:54.503Z caller=filesystem_common.go:76 collector=filesystem msg="Parsed flag --collector.filesystem.ignored-fs-types" flag=^devfs$
...
level=info ts=2021-02-13T03:37:54.503Z caller=node_exporter.go:195 msg="Listening on" address=:9100
...
|
访问 http://localhost:9100/metrics,可以看到当前 Node exporter 获取到的当前主机的所有监控数据,如下所示:
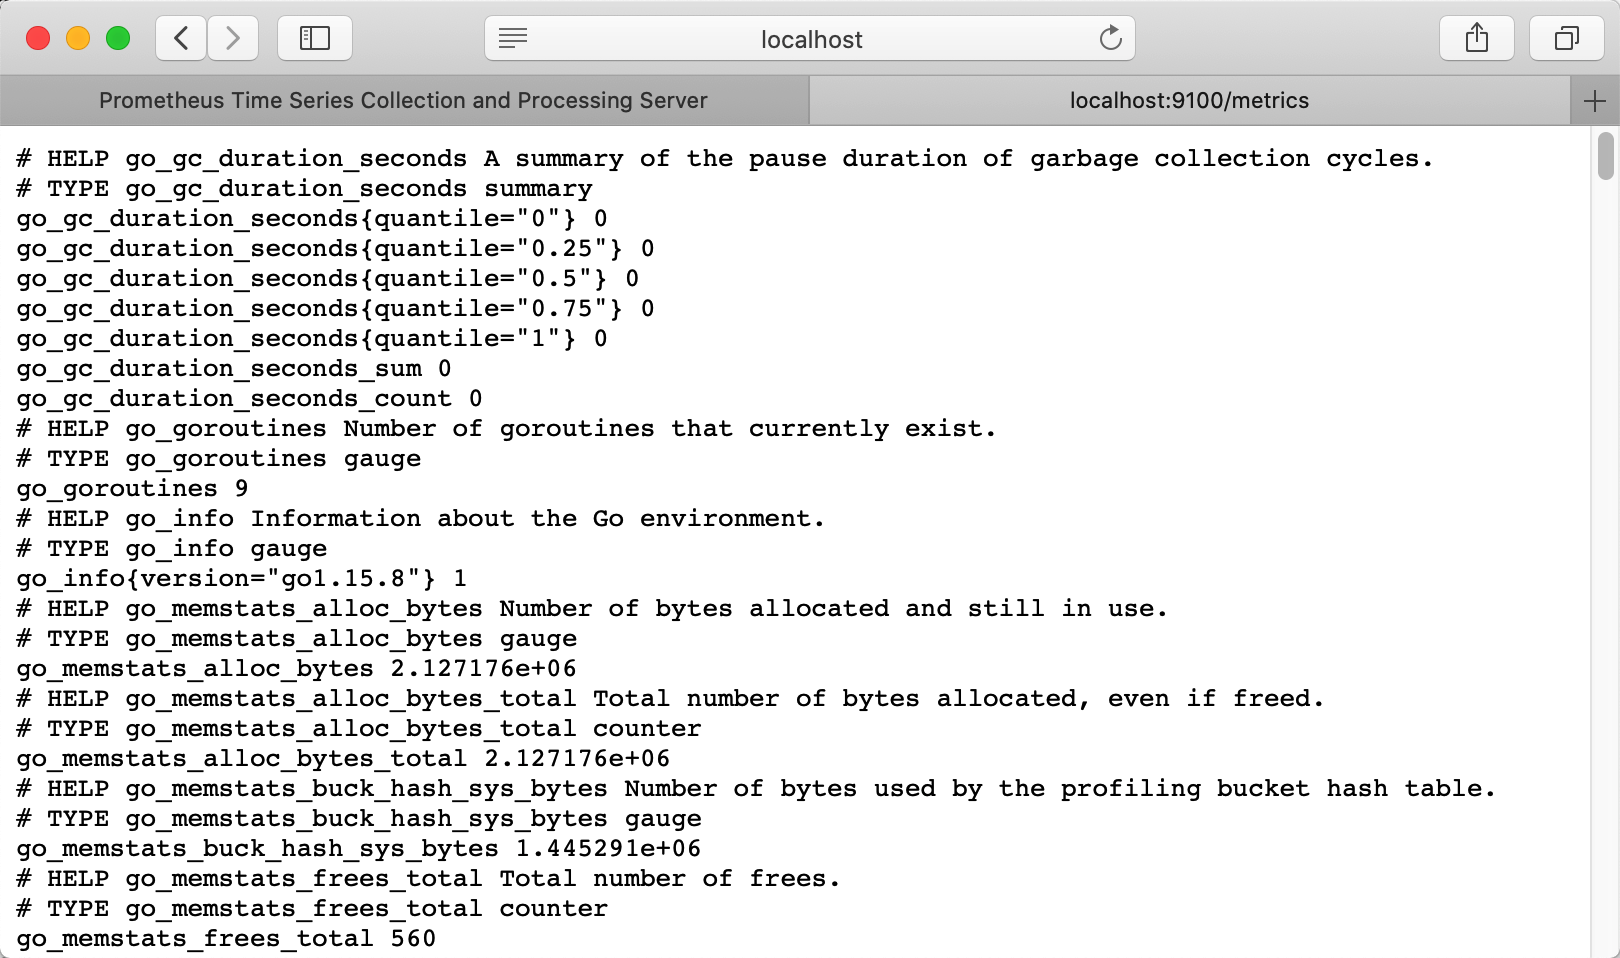
每一个监控指标之前都会有一段类似于如下形式的信息:
1
2
3
4
5
6
|
# HELP node_cpu Seconds the cpus spent in each mode.
# TYPE node_cpu counter
node_cpu{cpu="cpu0",mode="idle"} 362812.7890625
# HELP node_load1 1m load average.
# TYPE node_load1 gauge
node_load1 3.0703125
|
其中 HELP 用于解释当前指标的含义,TYPE 则说明当前指标的数据类型。
从Node Exporter收集监控数据
为了能够让 Prometheus Server 能够从当前 Node exporter 获取到监控数据,这里需要修改 Prometheus 配置文件。编辑 prometheus.yml 并在 scrape_configs 节点下添加以下内容:
1
2
3
4
5
6
7
8
|
scrape_configs:
  - job_name: 'prometheus'
    static_configs:
      - targets: ['localhost:9090']
  # 采集node exporter监控数据
  - job_name: 'node'
    static_configs:
      - targets: ['localhost:9100']
|
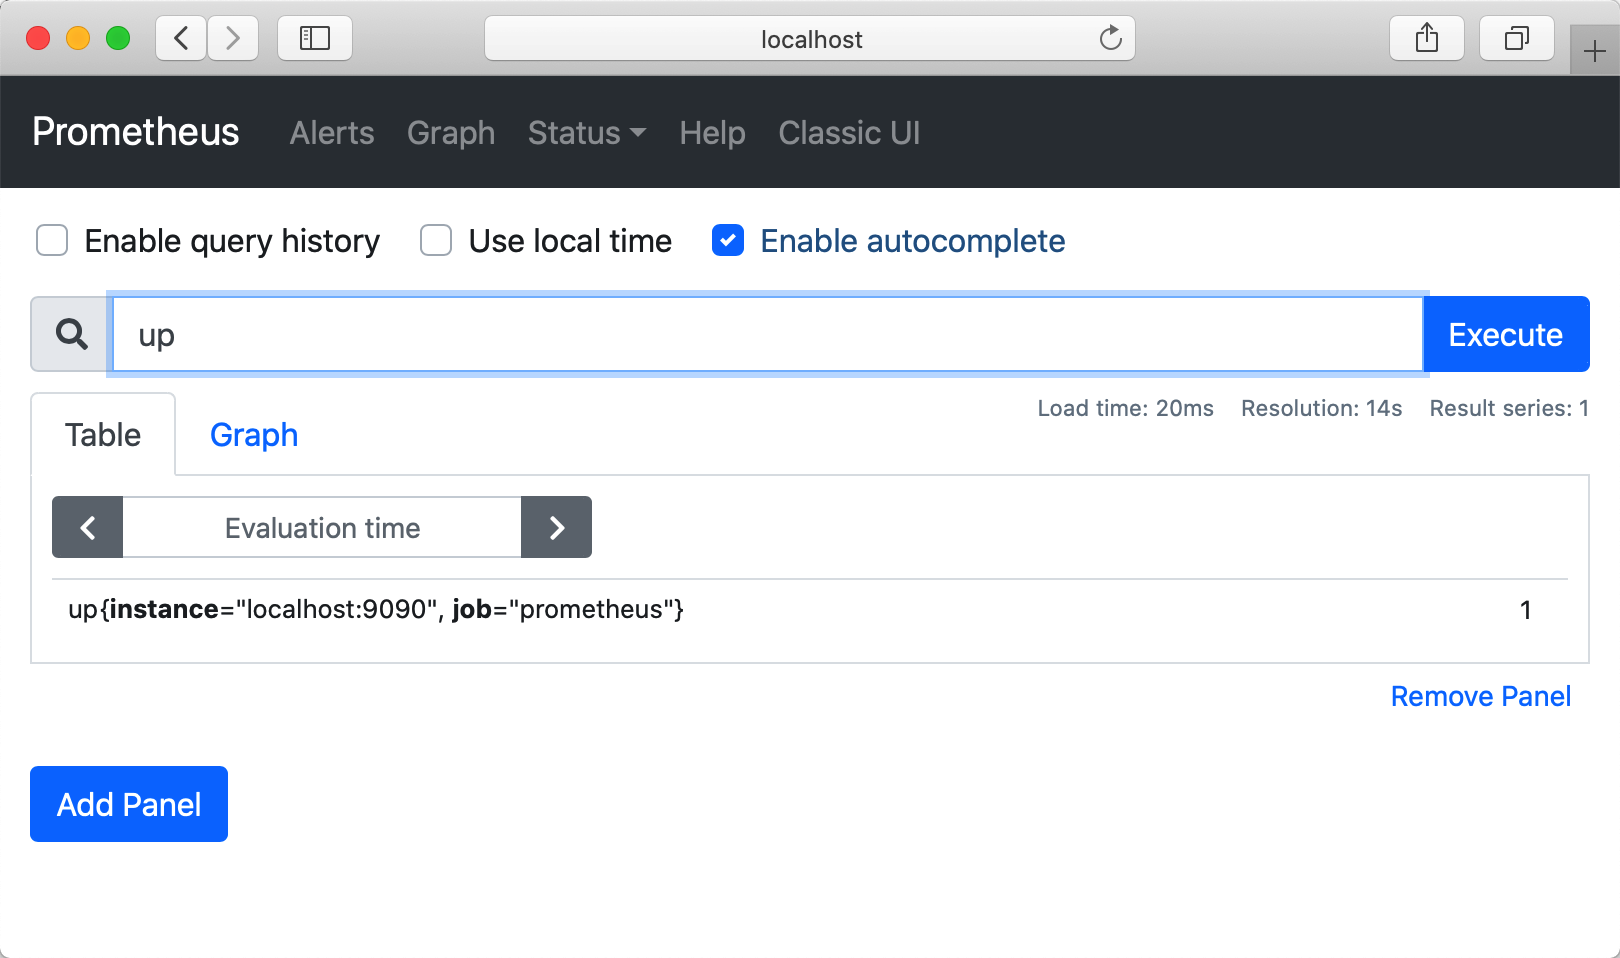
重新启动 Prometheus Server,访问 http://localhost:9090,进入到 Prometheus Server。如果输入“up”并且点击执行按钮以后,可以看到如下结果:
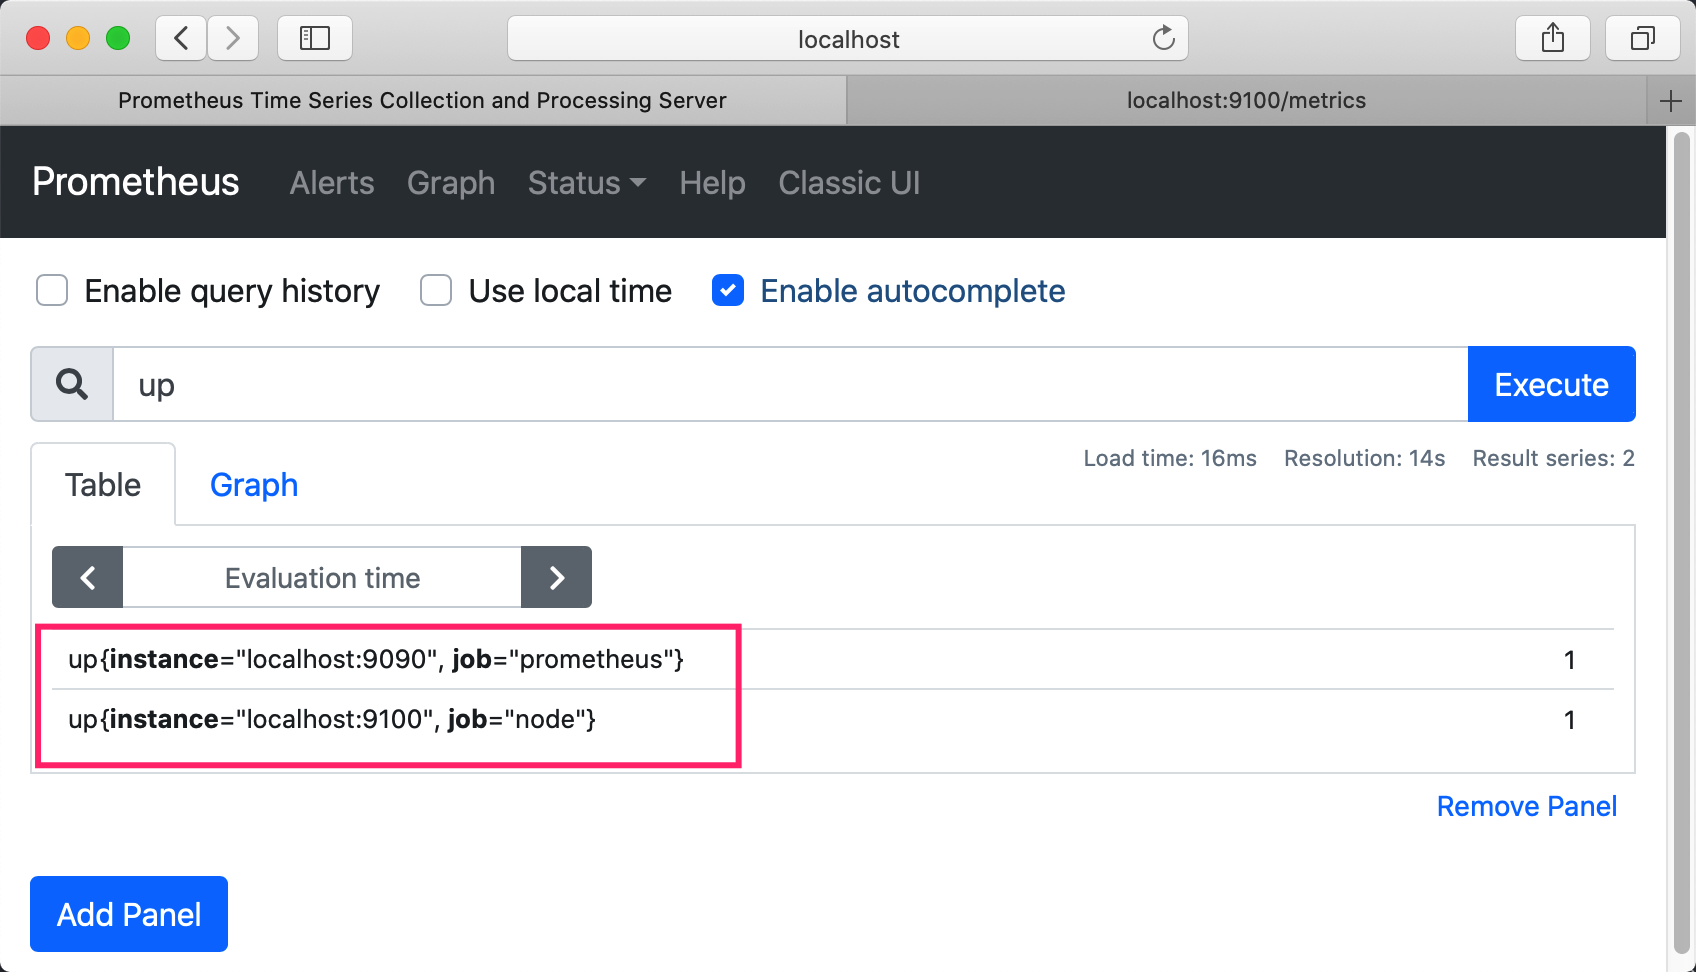
如果 Prometheus 能够正常从 Node exporter 获取数据,则会看到以下结果:
1
2
|
up{instance="localhost:9090",job="prometheus"}    1
up{instance="localhost:9100",job="node"}    1
|
其中“1”表示正常,反之“0”则为异常。
快速入门 PromQL
配置完 Prometheus 读取的数据源之后,Prometheus 便可以从 Node Exporter 获取到数据了。那么接下来我们如何查看到这些数据呢?答案是:Prometheus UI!
Prometheus UI 是 Prometheus 内置的一个可视化管理界面,我们通过 http://localhost:9090 就可以访问到该页面。通过 Prometheus UI 可以查询 Prometheus 收集到的数据,而 Prometheus 定义了 PromQL 语言来作为查询监控数据的语言,与 SQL 类似。
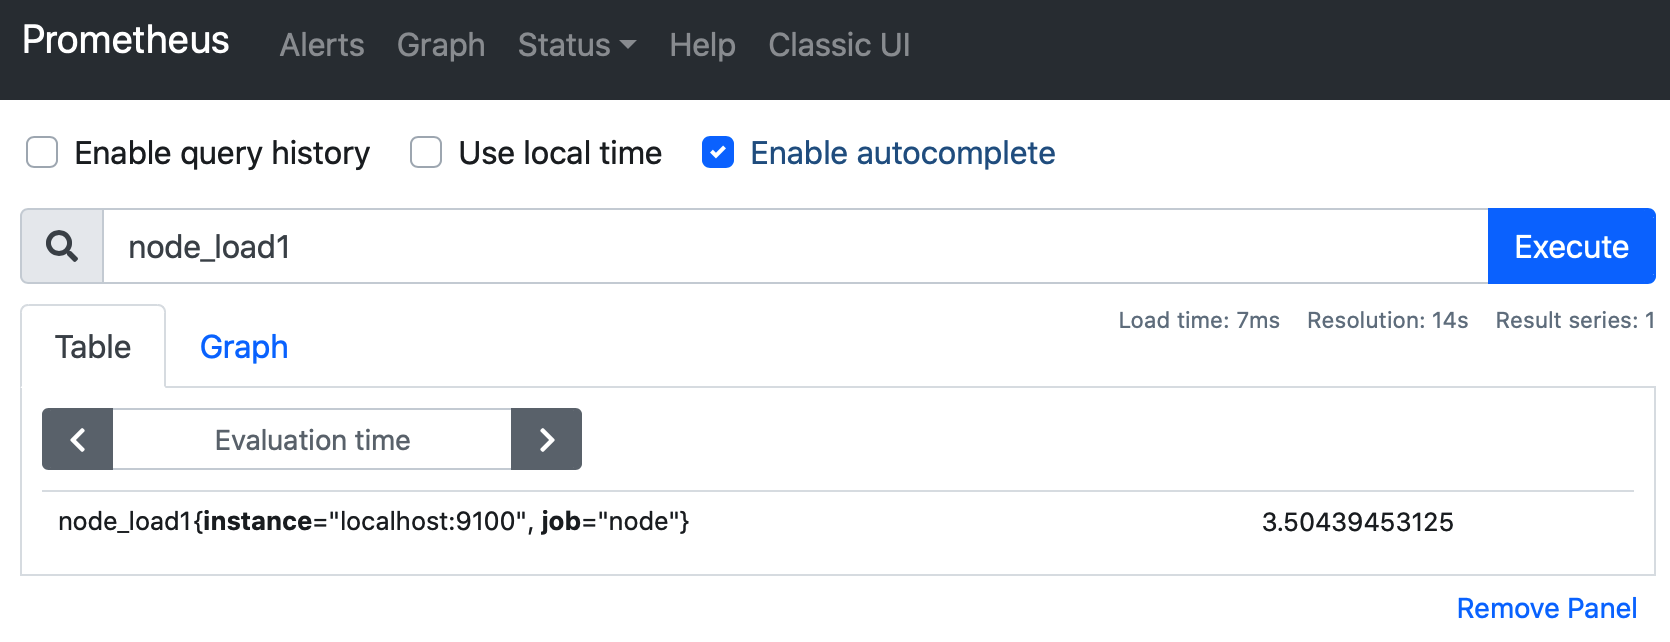
查看 NodeExporter 节点所在机器 CPU 1 分钟的负载情况,可以输入 node_load1 即可查看:
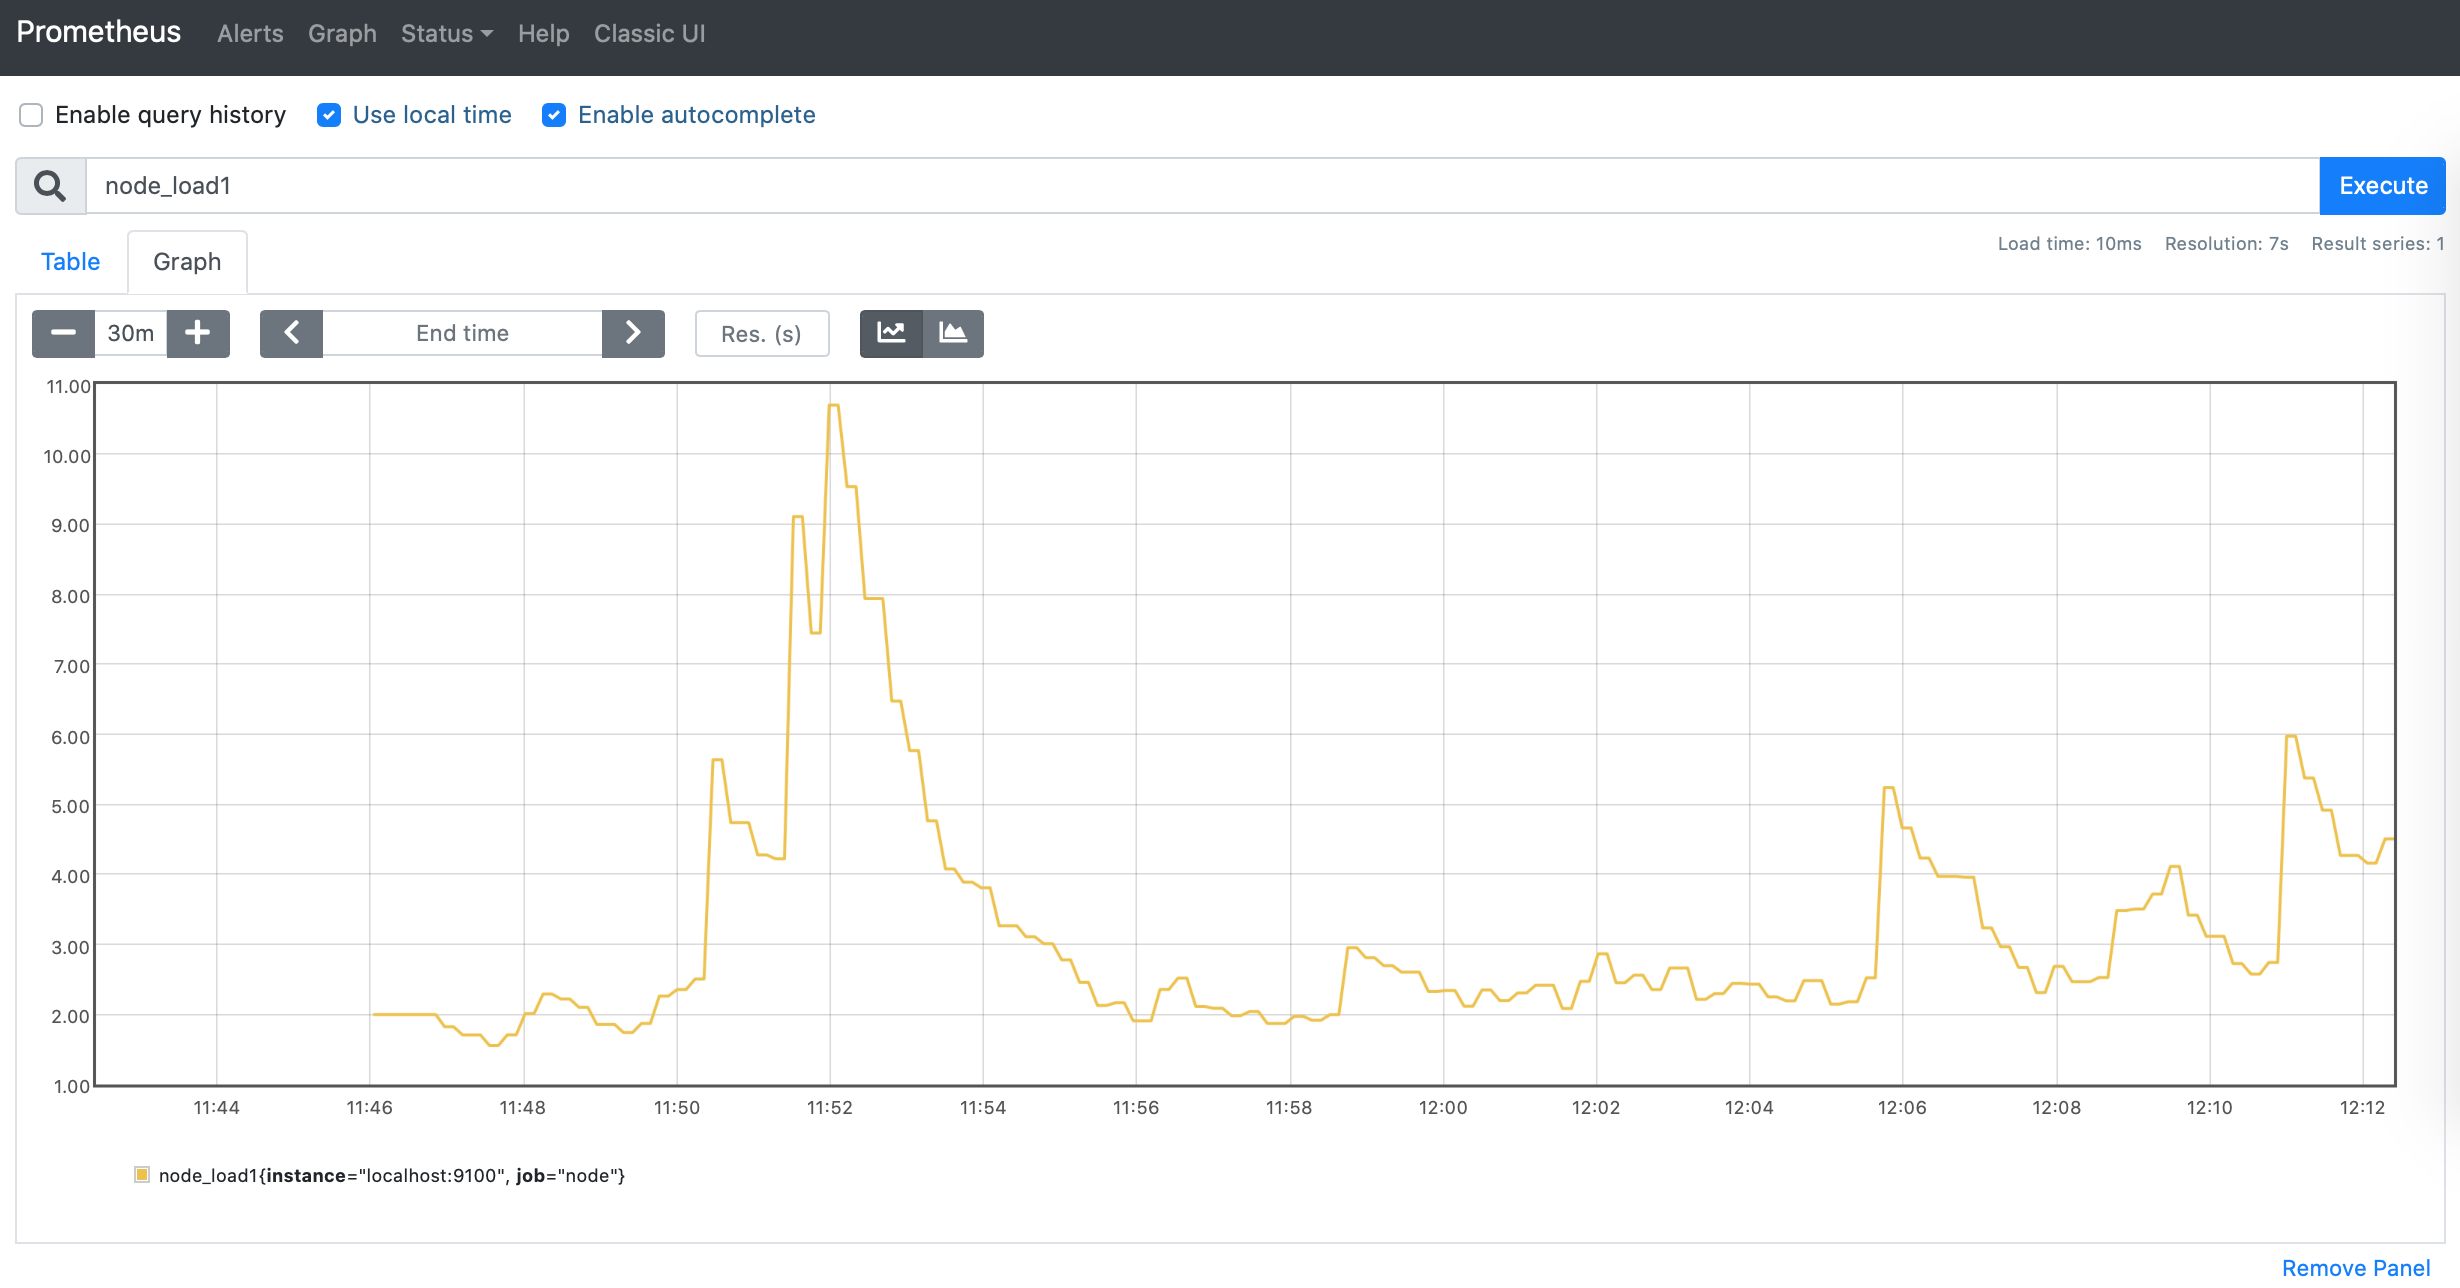
切换到 Graph 面板,用户可以使用 PromQL 表达式查询特定监控指标的监控数据。如下所示,查询主机负载变化情况:
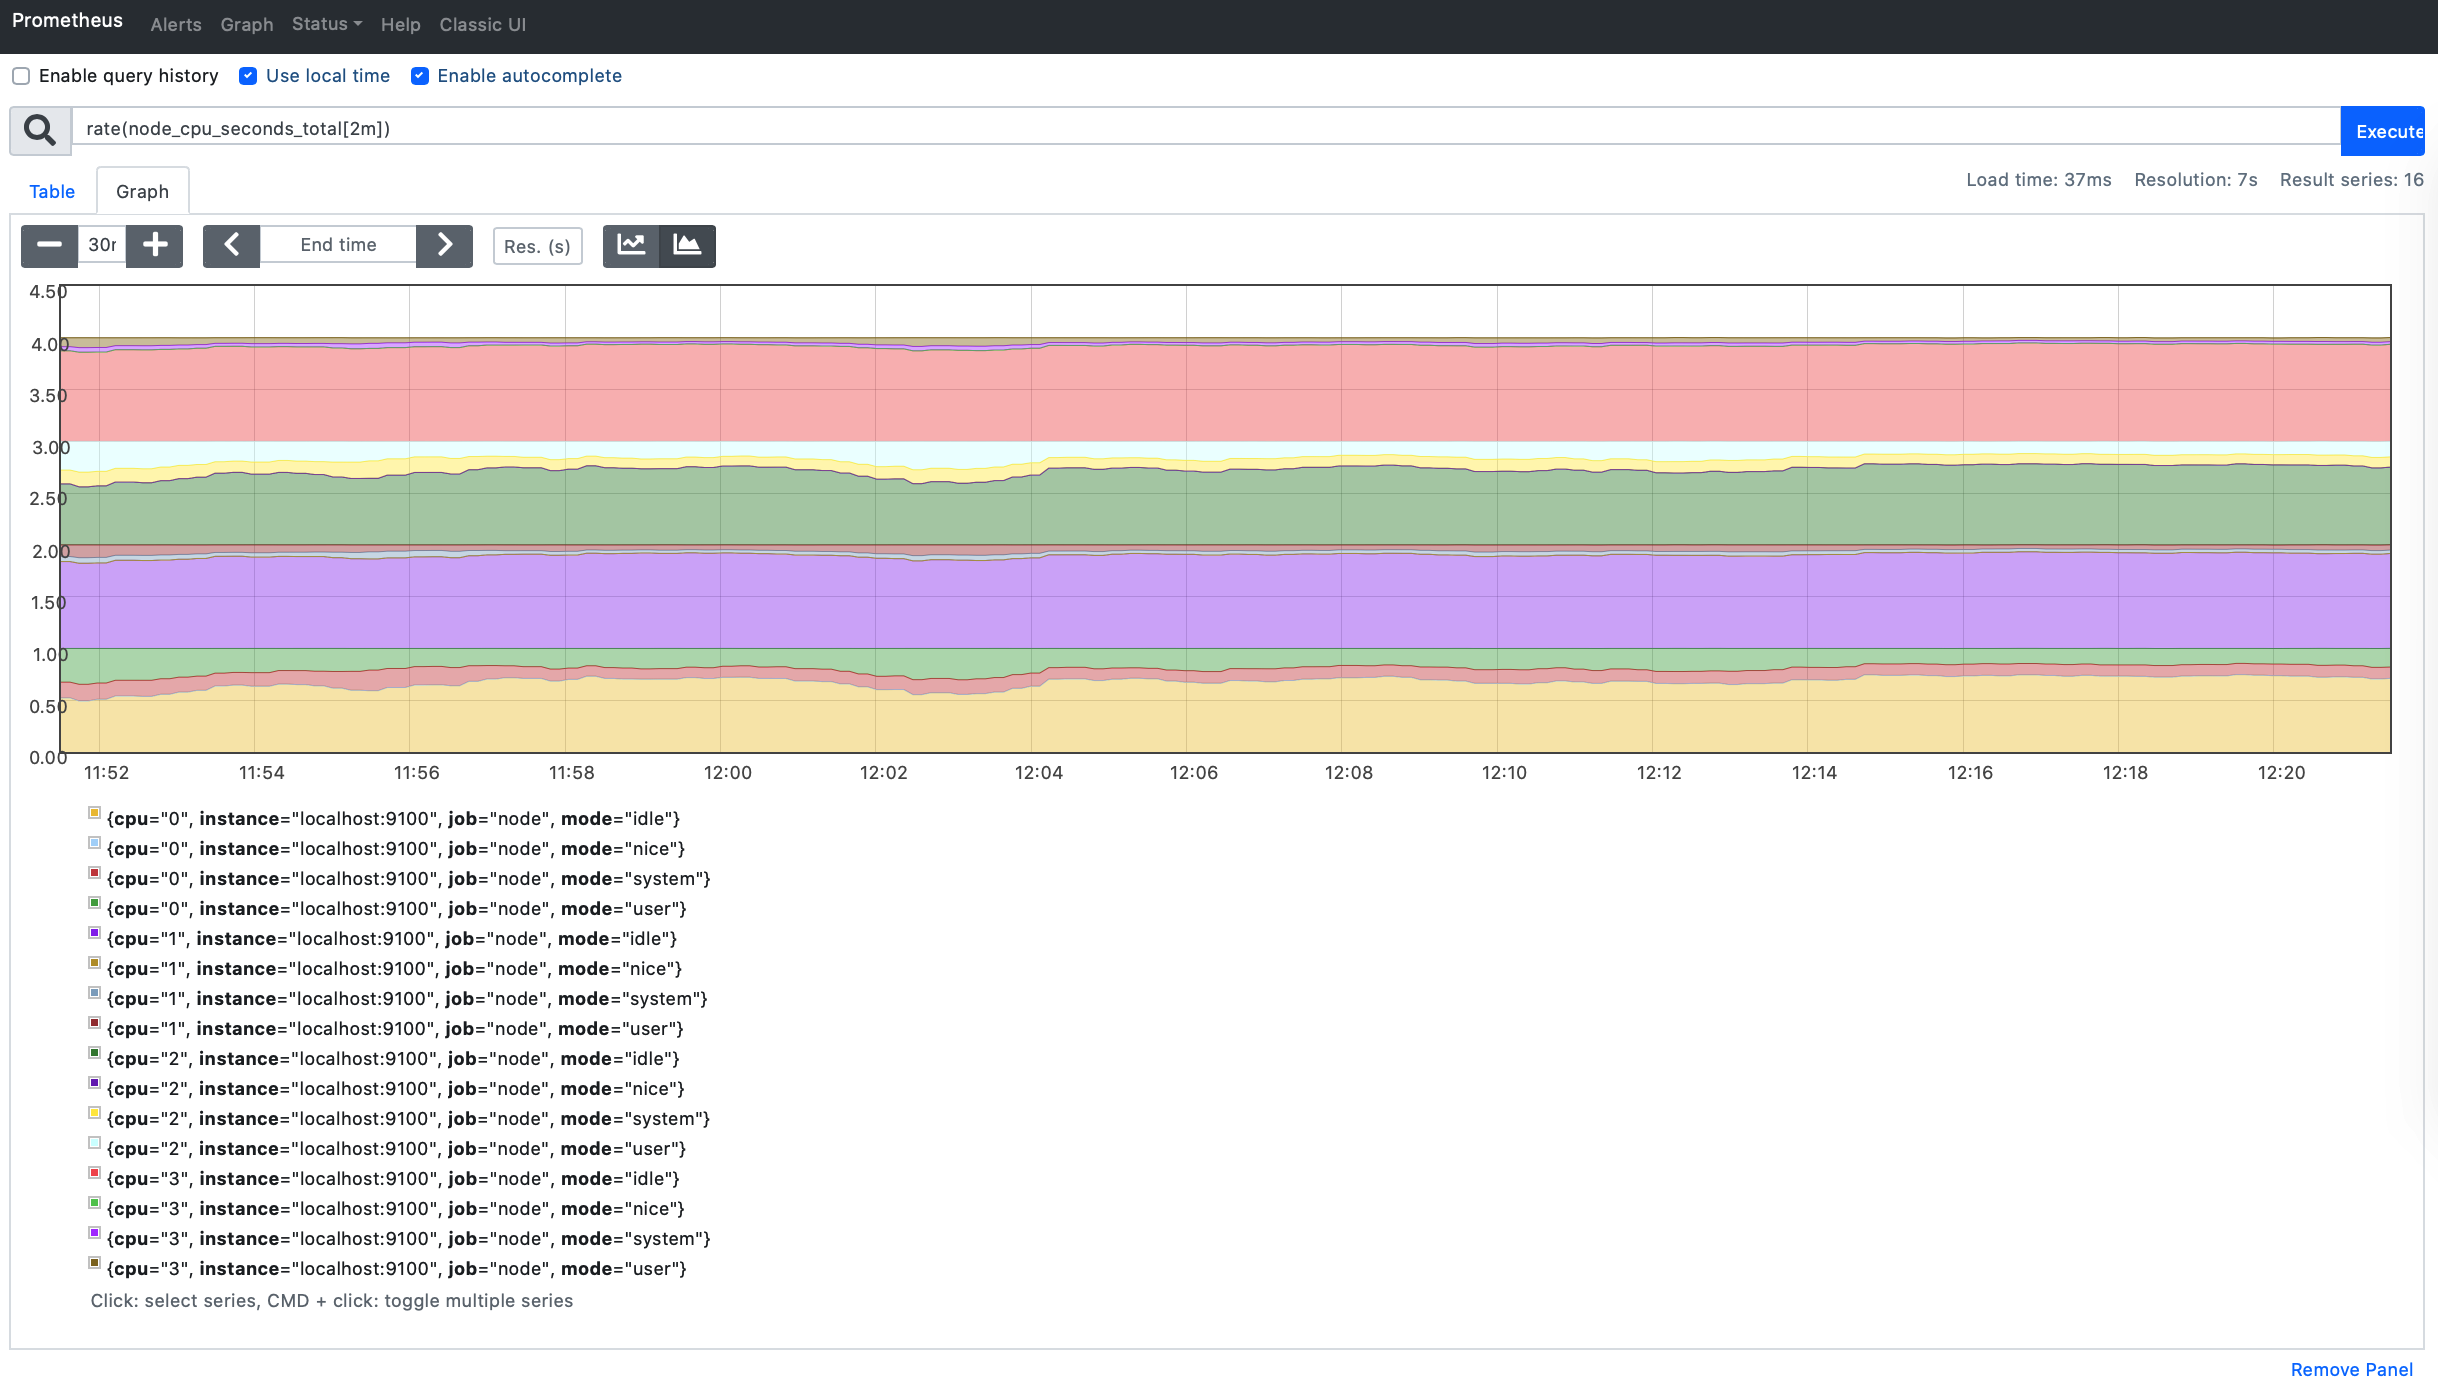
PromQL 是 Prometheus 自定义的一套强大的数据查询语言,除了使用监控指标作为查询关键字以为,还内置了大量的函数,帮助用户进一步对时序数据进行处理。例如使用 rate() 函数,可以计算在单位时间内样本数据的变化情况即增长率,因此通过该函数我们可以近似的通过 CPU 使用时间计算 CPU 的利用率:
PromQL 先了解到这里,后面会有专门的文章来详细学习 PromQL 语法。
参考
https://prometheus.io/download/
https://yunlzheng.gitbook.io/prometheus-book/
https://www.cnblogs.com/chanshuyi/p/01_head_first_of_prometheus.html